Aurora LightZ™ elevates planning with advances in the state-of-the-art AI and analytics with an intuitive/no-code platform where AI and analytics are built-in . . . no need for high-quality data, model training, data science/statistics skills, or IT support. LightZ is for the business user seeking insights through unbiased predictions/forecasts for data driven decisions for better planning that increase business performance.
You can react to the future when it arrives, or plan to make the future happen with LightZ.
Unlimited Users
Unlimited Models
Unlimited Data
- Aurora AWS or Azure cloud or your premise -
2 Users
12 Models
4gb Data
- Aurora AWS cloud -
1 User
Unlimited Models
1gb Data
- Your laptop/desktop -
$500 billion is spent annually by IT on all aspects of enterprise software, yet the average demand forecast error is 35%, excess & obsolete inventory about 25%, and $60 billion a year is wasted on labor to prepare spreadsheets. Enter LightZ with its built-in AI and analytics to elevate forecast and prediction accuracy beyond spreadsheets, demand planning, data visualization, and budgeting tools across sales, finance, and operations.
Other tools require someone to apply the appropriate analytics to derive insights. With LightZ, just load data and its AI builds a full function model complete with reports and intelligent interactive charts that apply built-in AI and analytics that automatically deliver fast-to-value insights. With LightZ it’s literally load-and-go!
Dashboards can be informative by showing trends of the past, but typically not insightful to apply the analytics needed to predict the future. You are blind to know if that good trend on the dashboard will go bad, thus potentially leading you to an erroneous decision.
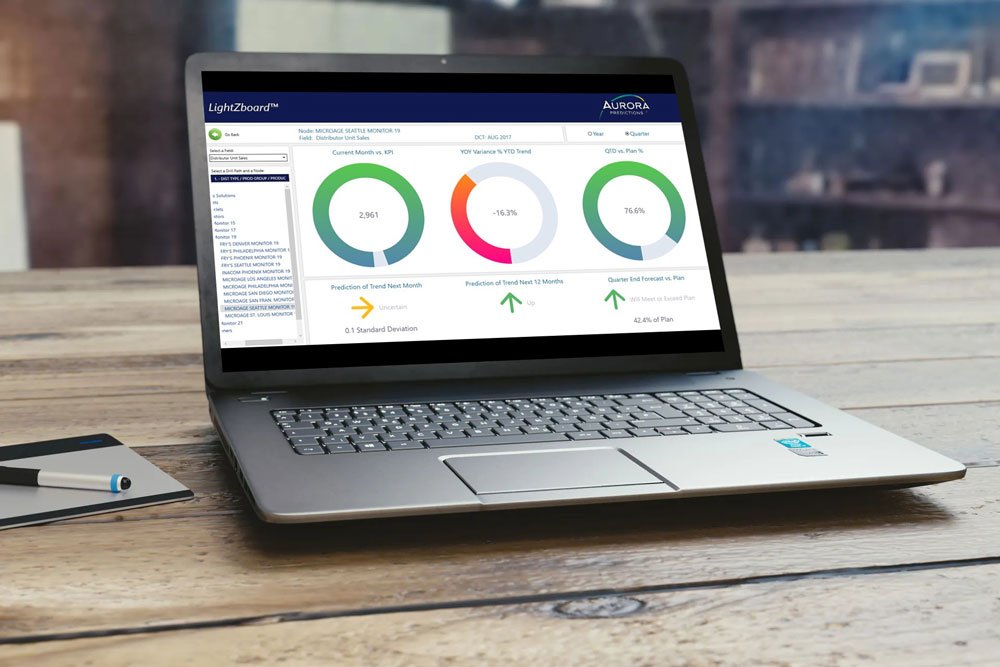
LightZboard™ shows the doughnuts of the past and present against KPIs and budgets, then its AI arrows displays an unbiased prediction of the future. In one view, gain actionable insights and foresight of upcoming trends and probability to make targets with months of runway to either course correct down-turns or accelerate advantages.
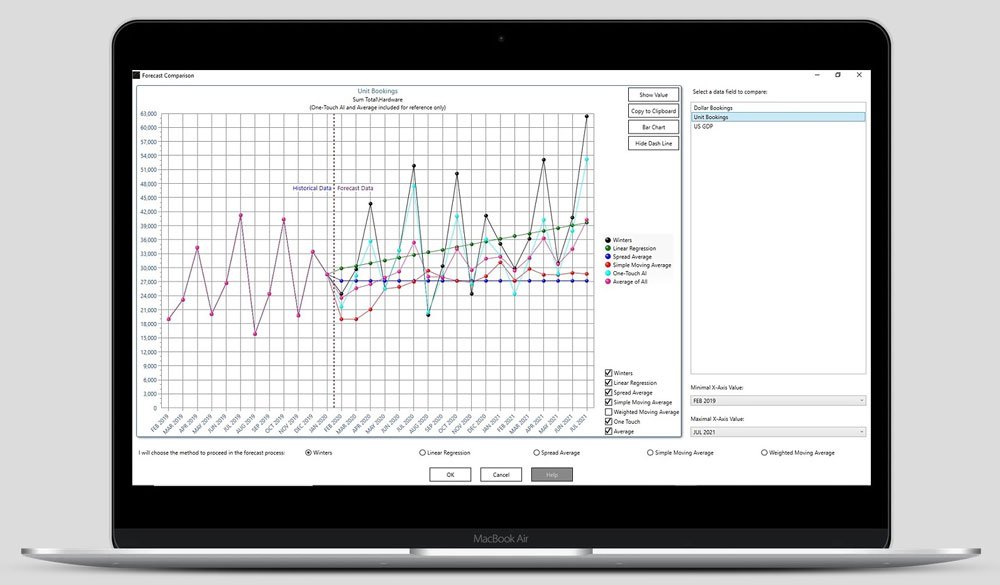
AI delivers high value. Case-and-point, a $500 million CPG manufacturer spent the time and capital to contract the building of a custom ML forecasting model and attained a remarkable 93% overall accuracy in forecasting its distributor’s demand depletions a year in advance. That same model attained 86% accuracy for its shipments. Both results roundly beat the typical accuracy from spreadsheets, budgeting, and demand planning tools. However, enter the groundbreaking LightZ One-Touch AI forecast, which out-of-the-box (no model building or training) achieved an astounding 99% accurate forecast for depletions a year in advance and 95% accurate forecast for shipments.
All forecasts are wrong, but what’s needed is a forecast range by which business can confidently plan. In conjunction with LightZ AI forecasting, Monte Carlo Simulation produces statistical probability bands of outcomes of the forecast based on the volatility in the business. The central yellow band offers the planning range, and outer bands reveal the total probability. LightZ built-in MC Simulation is profoundly valuable for dynamic inventory min/max levels that optimize inventory, or achieving SLA targets, or understanding the inherent risk in the forecast.

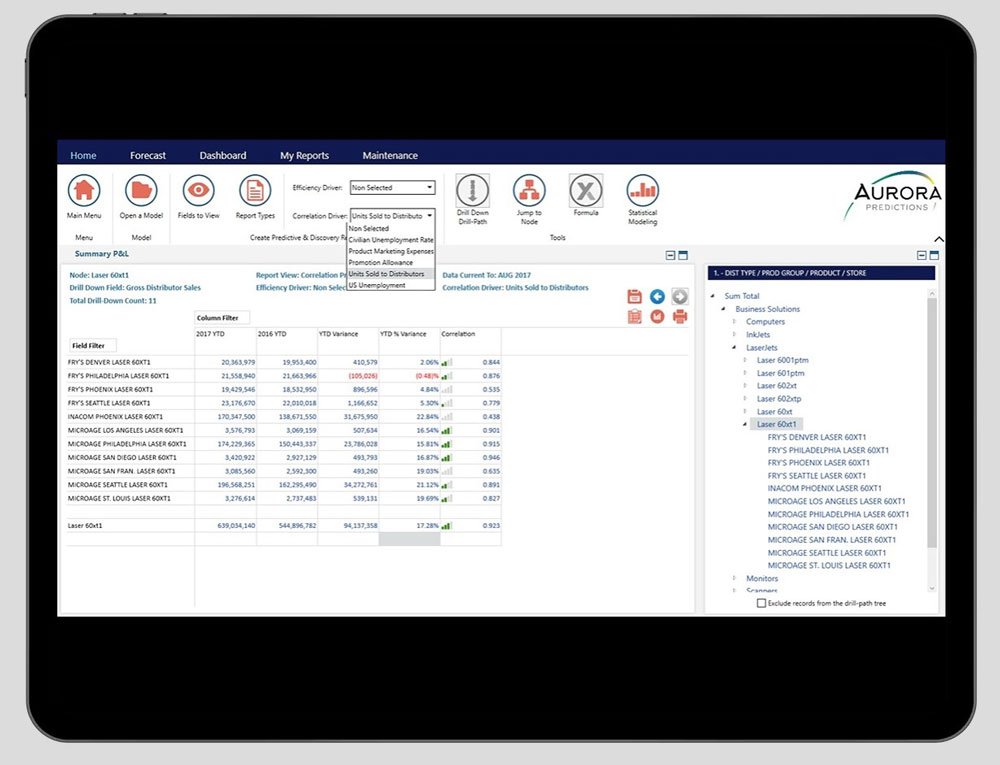
Correlations reveal relations within and external to the business. With LightZ, simply point-and-click to find correlations across the business or use the built-in AI to identify correlations of leading indicators. No need to be a statistician, as cell bars are displayed to show the relative strength and relation of correlation. LightZ has a built-in library of external economic indicators for use in correlations or add your own simply through a spreadsheet interface.
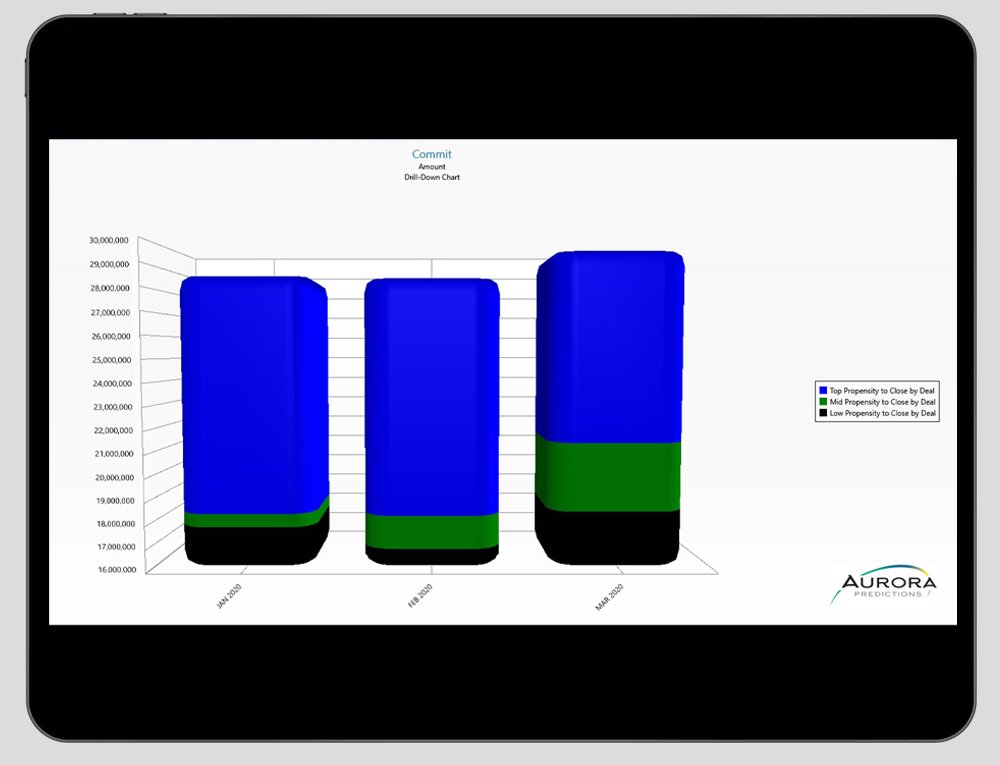
“I know 50% of the deals in the Commit stage of the sales pipeline will not close. I just don’t know which 50%.” So lamented the director of inventory of a $4 billion manufacturing company. However, the LightZ Sales Propensity Score can predict those deals that have a high, medium, and low propensity to close by just loading CRM data. Now gain a view to better allocate sales resources toward producing high quality sales and mitigating the “unnatural” acts of discounts and concessions.
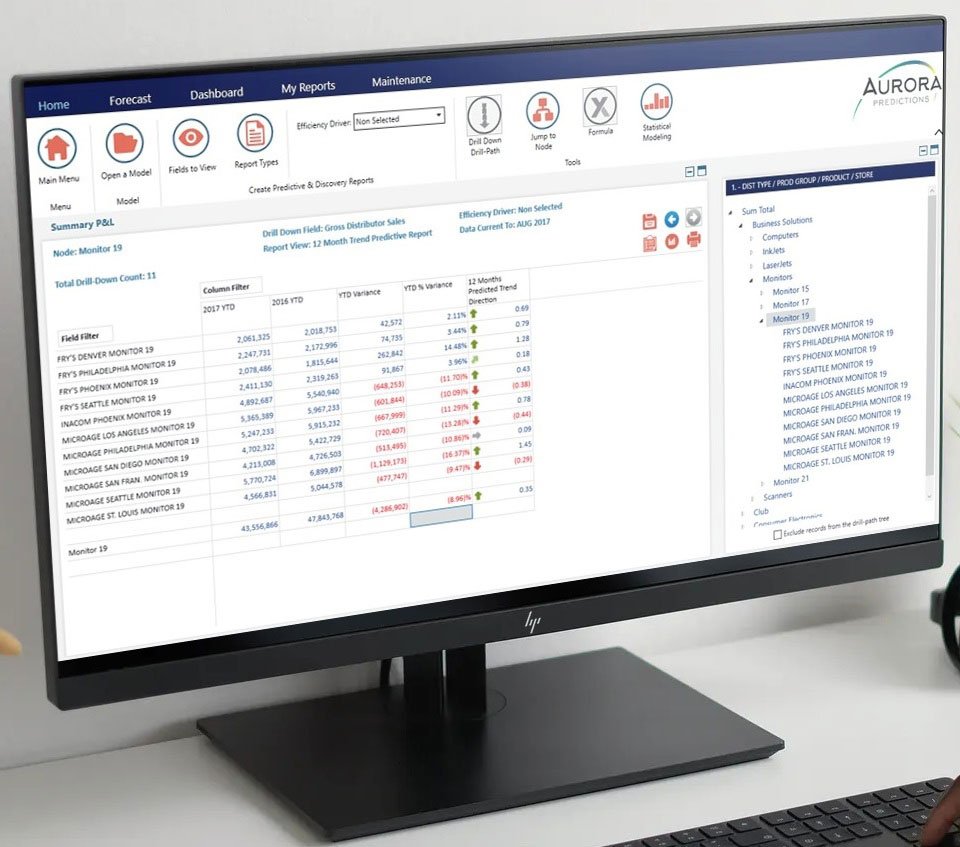
We don’t need another chart to show the historical trend . . . We need an unbiased view into the future! LightZ AI-Enabled Predicted Trend Direction, with its simple to read arrow informs of the future of the trend. Now pin-point a bad trend is predicted to get better, so you don’t have to discount to improve sales. Take advantage to increase price of good trends predicted to get better. And know the good trends predicted to reverse so you can act now to close the barn door before the horse leaves.
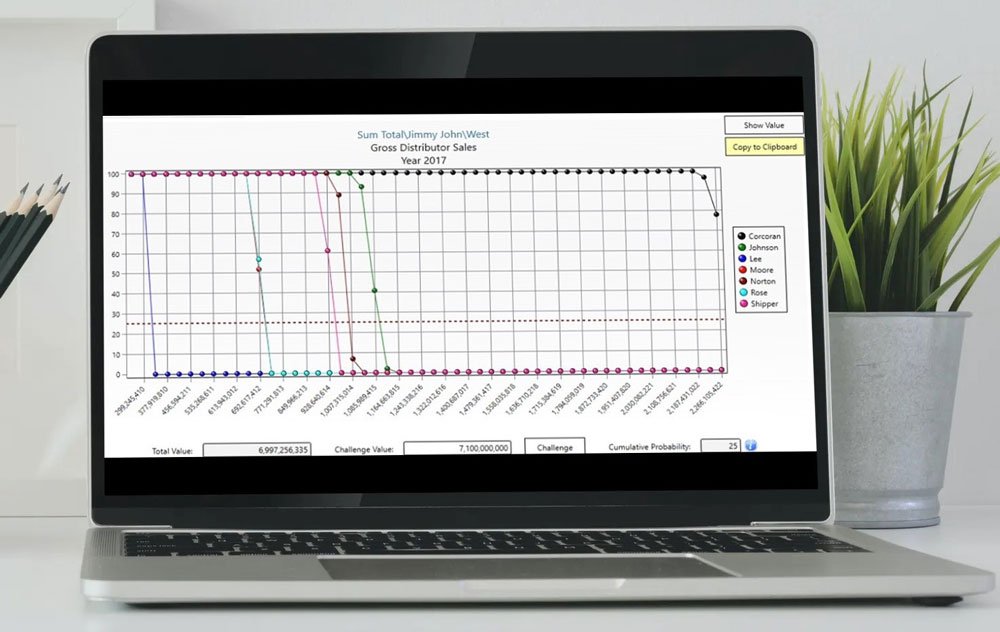
The budget/forecast is done – now the CEO says more sales are needed! You push back, saying the budget is assembled from the bottoms-up after weeks of work, but to no avail. Your choice – distribute the stretch equally or proportionally across the Sales Reps, which you know will disquiet some Reps that consider they’re being unfairly targeted.
Enter AI Fair Challenge to calculate the probability of attaining the stretch goal. For example, if the challenge is $100 million more sales, LightZ predicts, say, a 25% probability of attainment – an unbiased quantitative assessment of the challenge. If the decision is to proceed with the stretch, then the amount is distributed so that each Sales Rep has a 25% probability of attainment; i.e. all have a “Fair” challenge.
ML is the most popular form of AI but needs large amounts of high-quality data to train the ML model, and as such ML is highly specialized to the data it’s trained on. Aurora’s EmeraldZ AI™ is an innovation, in that rather than being trained by data, EmeraldZ “thinks” through data making it independent of a particular dataset and transportable through any datasets.

[LightZ™ is] faster than Tableau and more informative.
James S
LightZ [solves] the problem of . . . surface level [reporting] . . . to deep dive into what is really going on . . . [plus] AI for predictive . . . insights.”
Lisa T
[LightZ is] simply beautiful. A [statistical] layman can use it.
Taswer K
[LightZ is] intuitive. Power BI is difficult.
Nick S
LightZ has a user friendly interface and I am easily able to access what I need for analytics.
Cynthia P
[LightZ™] optics great. Few buttons. Clean looking.
Trevor H
Problem with Tableau and other tools is that you don’t know what you’re looking for unless you know the features of the tool… [LightZ] is incredible [it delivers the insights automatically]
Arlen M